Professor Yanni Loukissas Is Helping Us See Data Differently
“How can we inspire people to use data as a means of changing the way they see the places they live?” asks Yanni Loukissas, an Associate Professor of Digital Media at Georgia Tech. This question drives every project Loukissas undertakes and defines his view of data. In his view, data isn’t just a collection of numbers on a spreadsheet; it’s a tool to engage with the world and a lens that can change how we see it. His mission is to help everyday people use data about the places they live in more effectively to better understand their environment and potentially become better stewards of those places.
Loukissas often emphasizes the importance of using data in context. He urges a shift in mindset “from data set to data setting”, focusing not only on what the data says but where and why it was collected, as well as how it might be repurposed. Data, he argues, never exist in a vacuum; they come from real places, real communities, and real experiences. By recognizing these “invisible entanglements” between data and setting, people can approach information more critically and creatively. He wrote about this approach at length in All Data Are Local: Thinking Critically in a Data-Driven Society.
The Glass Pigeon Project: Seeing the World Through Bird Data
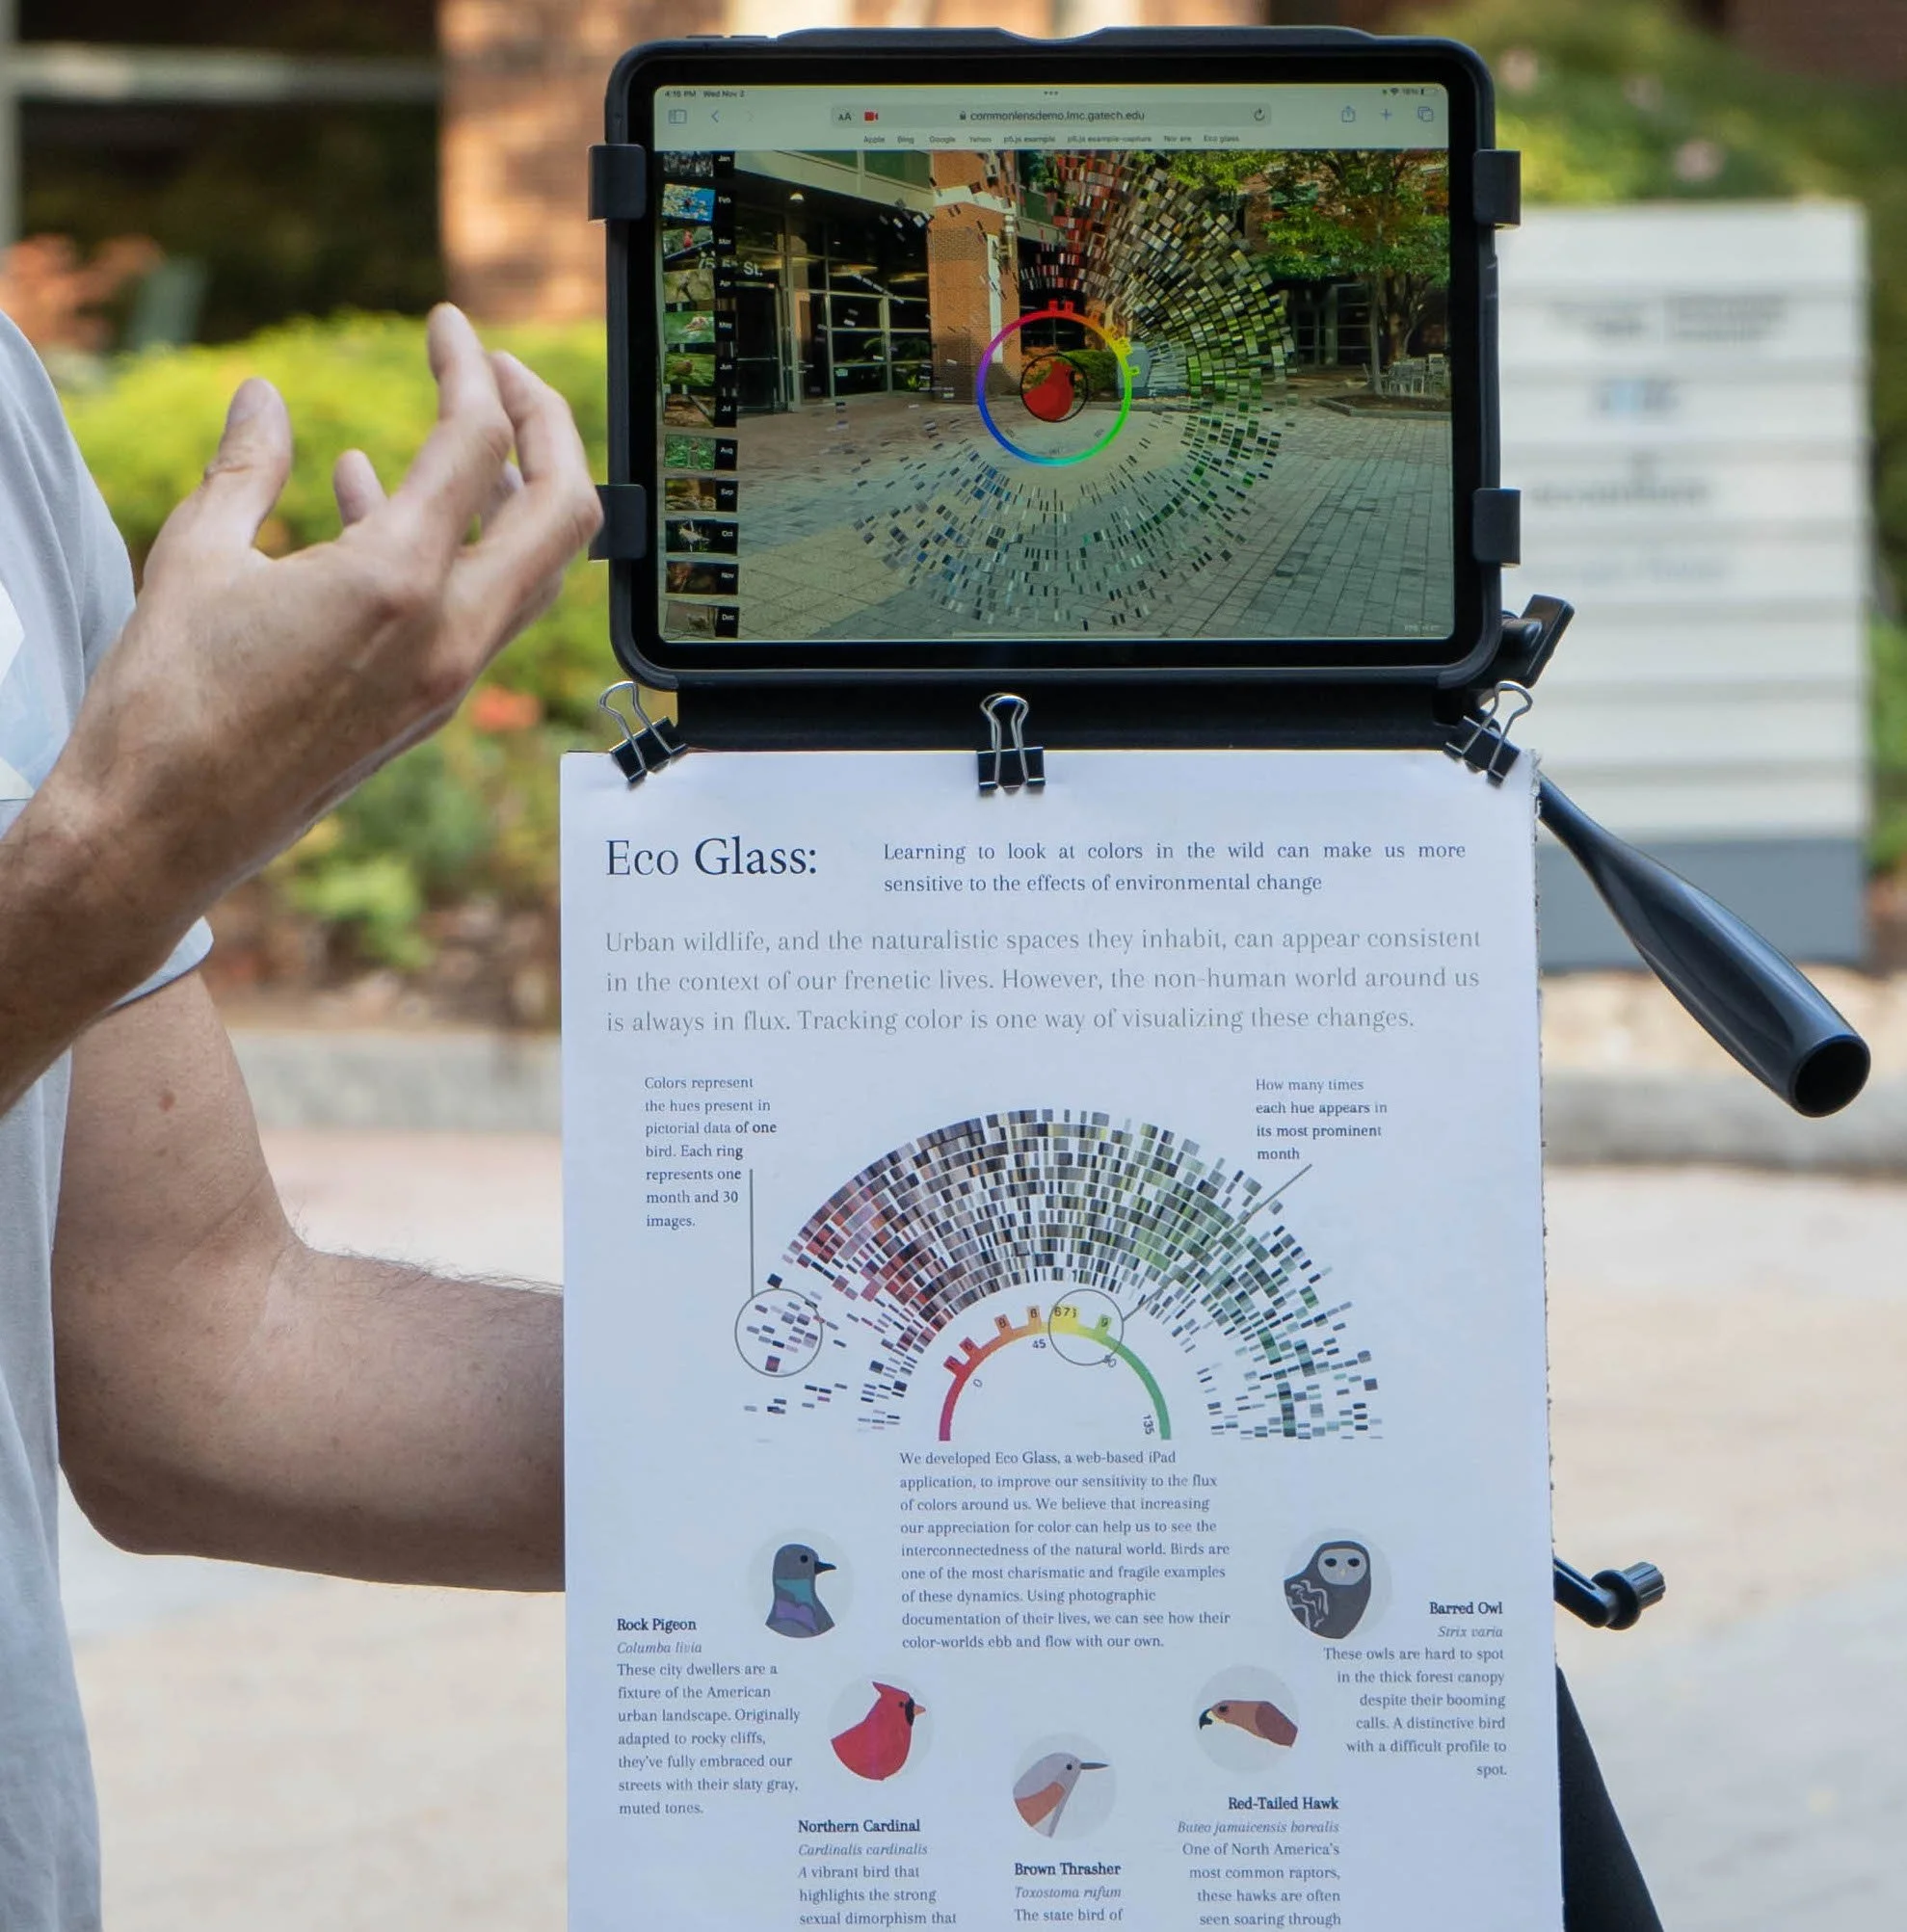
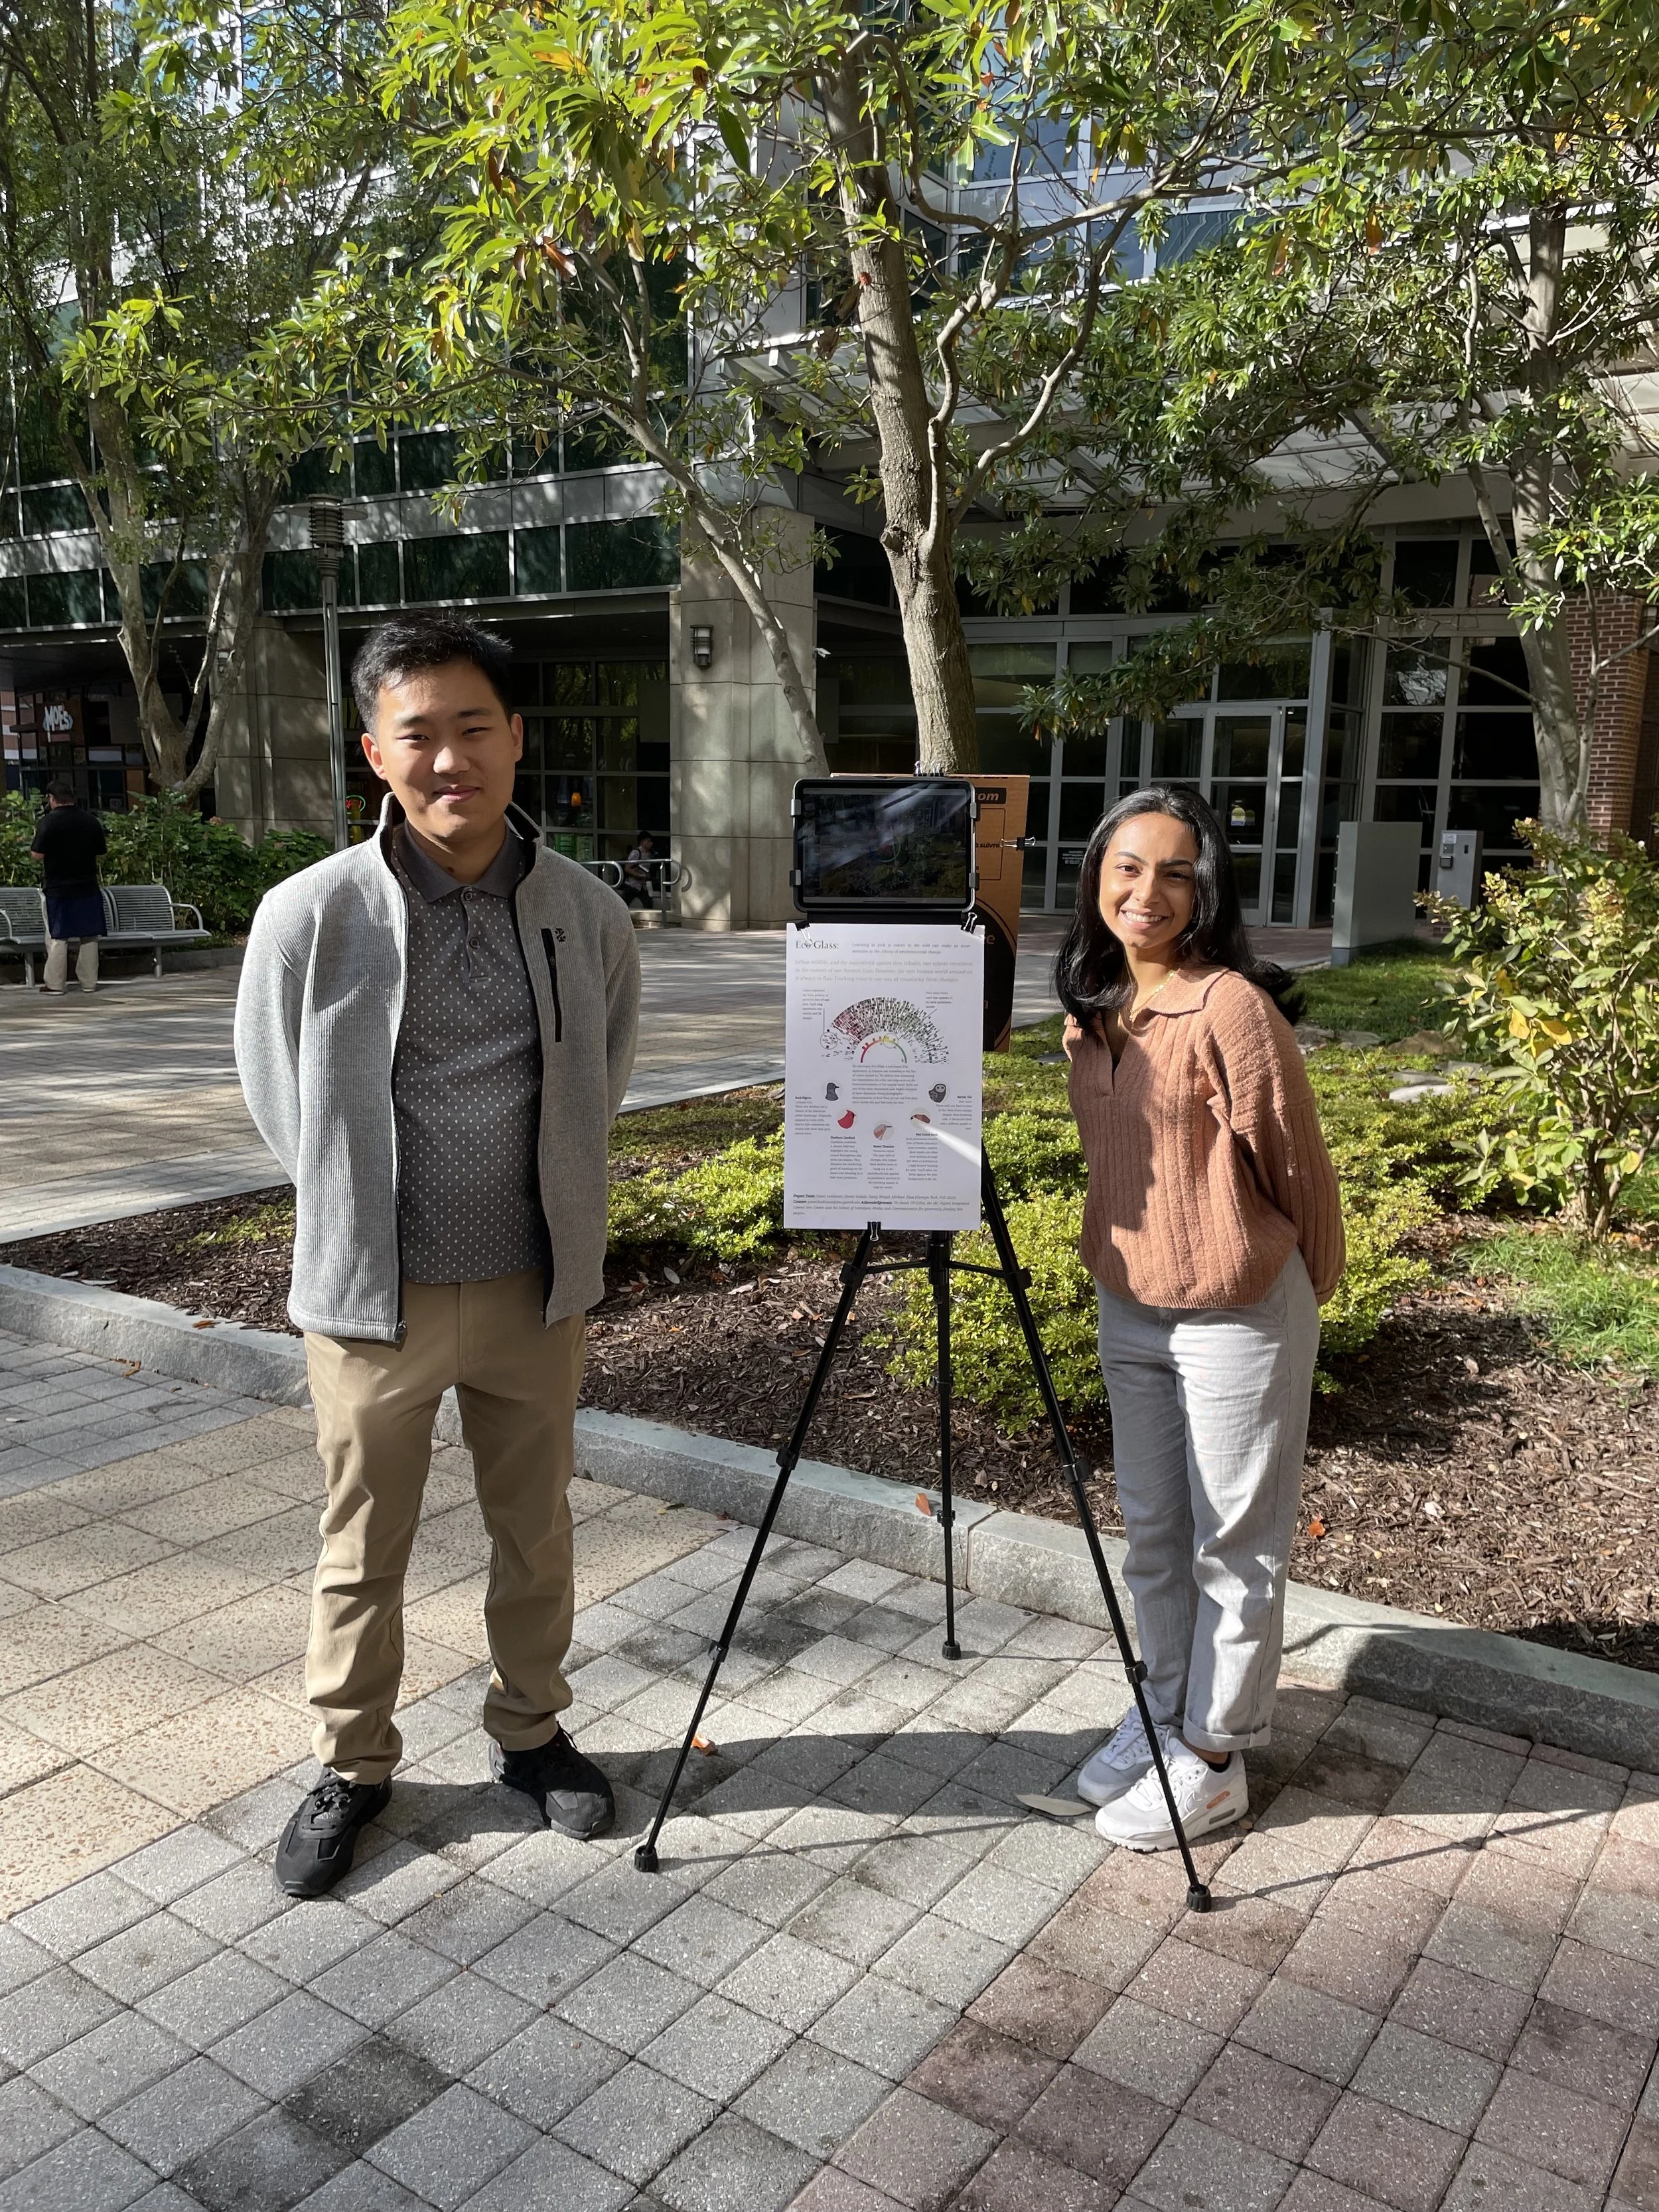
One vivid example is the Glass Pigeon Project (officially called Pigeon Glass), an augmented-reality (AR) app that lets people see campus through a bird’s eyes by layering bird color data onto live video. Developed in collaboration with Georgia Tech Professor and biologist Emily Weigel, as well as undergraduate students Michael Zhou and Shruti Vedula, Pigeon Glass utilizes eBird, a database of bird sightings (including local species such as pigeons and cardinals), to demonstrate how birds perceive color in their environment. Point the tablet’s camera at campus EcoCommons and you’ll see patches of color highlighted – a visualization of how a pigeon or hawk might find shelter or a mate amidst the greenery and concrete.
The goal is more than birdwatching. Pigeon Glass helps people develop “skills at seeing their environment” in new ways. By visualizing how birds rely on colors to survive (and how changes in those colors can spell life or death), participants become aware of subtler shifts in their own surroundings. That new perspective helped students grasp the impact of climate change and urban development on wildlife. For instance, an area of trees tinted in AR might illustrate where a cardinal could once hide from predators, now thinned out by construction. In this way, data becomes a story about our shared environment. Projects like Pigeon Glass turn data into both a lens and a tool. It becomes a way to look at the world differently and a means to act on what we learn.

Media Bridge: Making Microplastics Visible
Another of Loukissas’s initiatives sheds light on an invisible pollution problem through public art and data. “Plasmatic Mirror,” a project developed for the Georgia Tech Library Media Bridge, focused on microplastics, the tiny plastic particles that infiltrate our waterways but are nearly impossible to see. This project, developed in collaboration with Dr. Emily Weigel, PhD student Ploypilin Pruekcharoen, and undergraduate Miles Appleton, was displayed on a large, high-resolution screen mounted on a pedestrian bridge. Loukissas and his students wondered how Atlanta residents connect to their water supply. How could they visualize something like microplastic pollution, especially when hard data on local water quality is scarce?
The team’s solution was to turn data into an interactive experience. Passersby walking under the Media Bridge found themselves showered in words. Snippets of news text about microplastics broke apart and “stuck” to each passerby’s silhouette. Even the definition of microplastic appeared on the screen, making the pollution literally stick to people. It was a creative way to get non-experts to see themselves in a data story. By blending art and information, the Media Bridge installation transformed dry facts about pollution into an experience people could feel and remember. “How do we create an interactive experience with data that people could use to orient themselves to an issue?” Loukissas had asked. On the Media Bridge, he found one answer: immerse people in the data, and they may become more aware and ready to engage.
Youth Mapping for Coastal Resilience
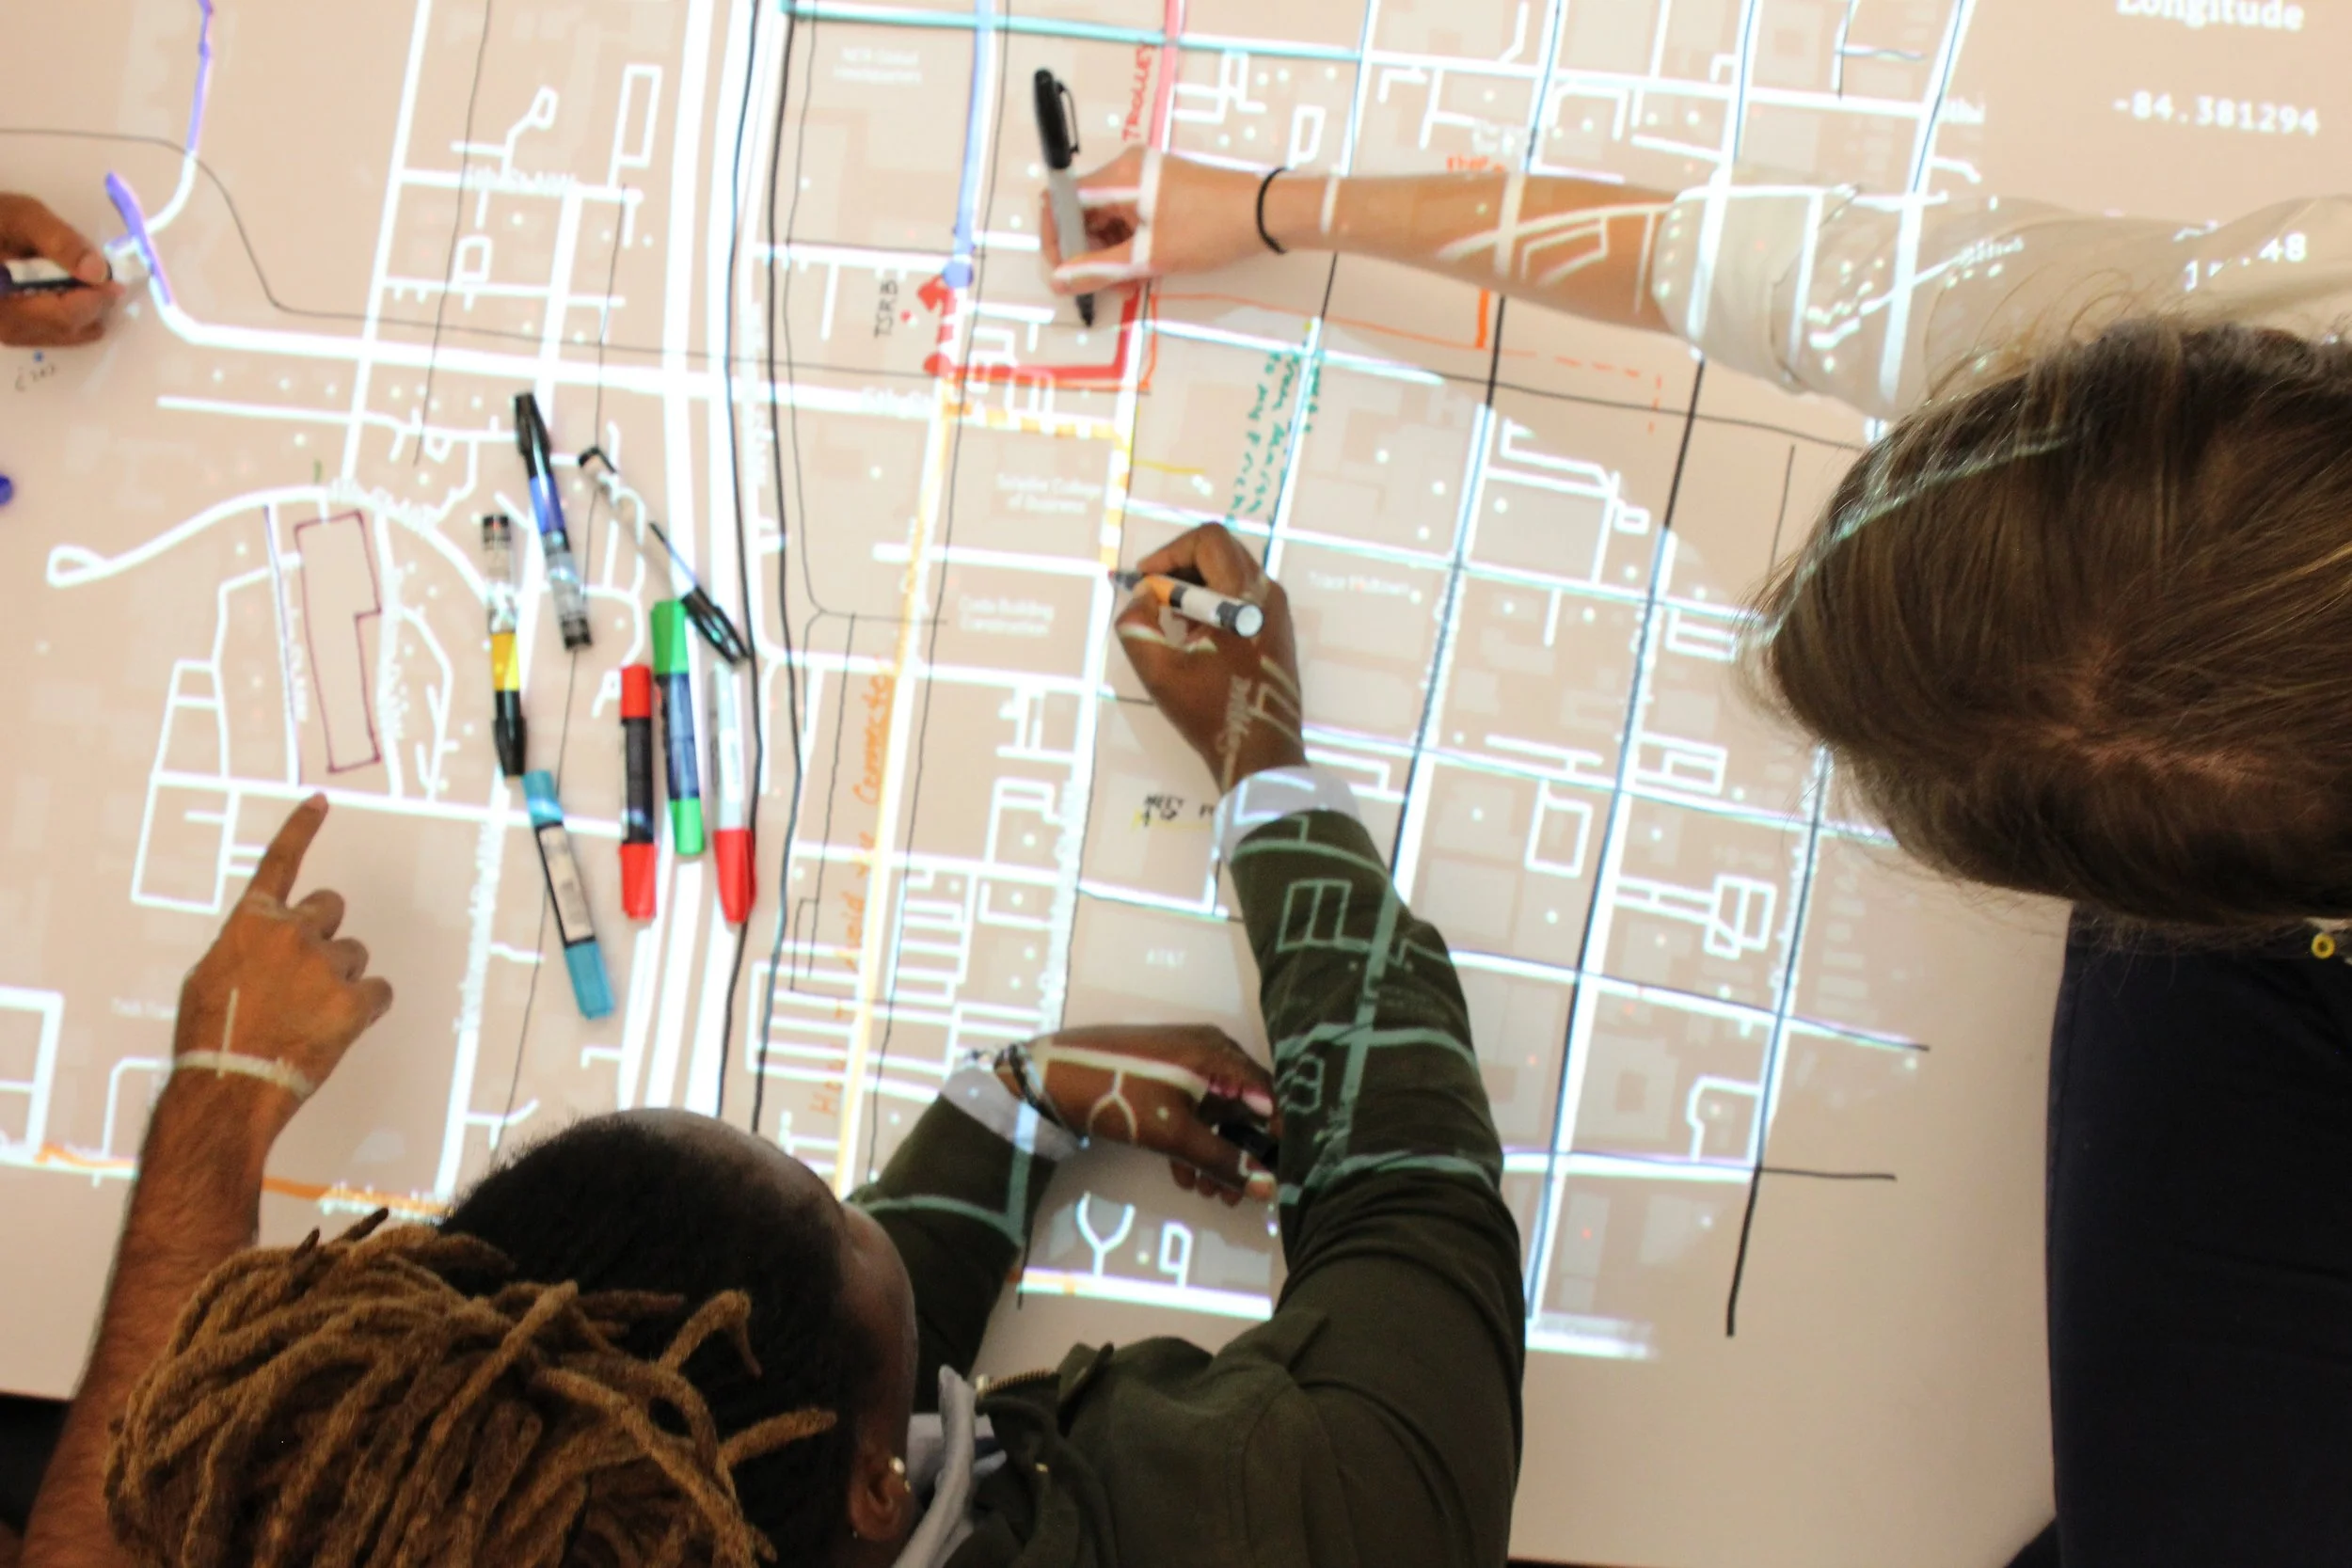
Loukissas’s philosophy of data as a tool for local empowerment extends beyond campus, into communities facing climate threats. Recently, he participated in a large-scale NSF-funded research project led by Georgia Tech Professor and Sociologist Allen Hyde to help youth in coastal Georgia use flood data to advocate for their communities. In places like Savannah, GA (where rising seas and storms are a growing concern), his team, including PhD students Mohsin Yousufi and Michelle Reckner, set up workshops to teach teens how to map potential inundations in their neighborhoods. Using models of sea-level rise created by Georgia Tech climate scientists, the students visualized what a few feet of water would mean for their community. They also layered their personal knowledge onto these maps – noting where high tide already creeps onto a street and which evacuation routes their families trust – effectively “putting their lived experiences on the map”.
As the students presented their flood maps, showing where a two-foot-high tide would reach a grandparent’s house, their demonstration made a strong impression on city leaders. By giving teens the tools to visualize their future and voice their concerns, his team helped a new generation see data as something they can own and utilize, rather than just something that happens to them.

Data as a Lens and a Tool
Across all these projects, the approach is the same: making data local, tangible, and empowering. Loukissas treats data not as an abstract trove for experts but as a medium for everyday learning and action. Whether through an AR app, an art installation, or a community mapping tool, he finds creative ways to ask what that information means for people today. It’s a perspective that resonates widely because it bridges technical information with human experience.
He hopes that by engaging with data that is close to home, people will become more attuned to local issues and more confident in addressing them. As he says, “Data gives entry to so many subjects, which is what I love about it”. In the hands of the communities and their members, data can become a meaningful part of the stories people tell about themselves and the places they live.